Grasim is forming a head and shoulders pattern. The head and shoulders chart pattern is a popular and easy to spot pattern in technical analysis that shows a baseline with three peaks, the middle peak being the highest. The head and shoulders chart depicts a bullish-to-bearish trend reversal and signals that an upward trend is nearing its end , and Grasim have support at 570 and resistance at 462 (making shoulders).
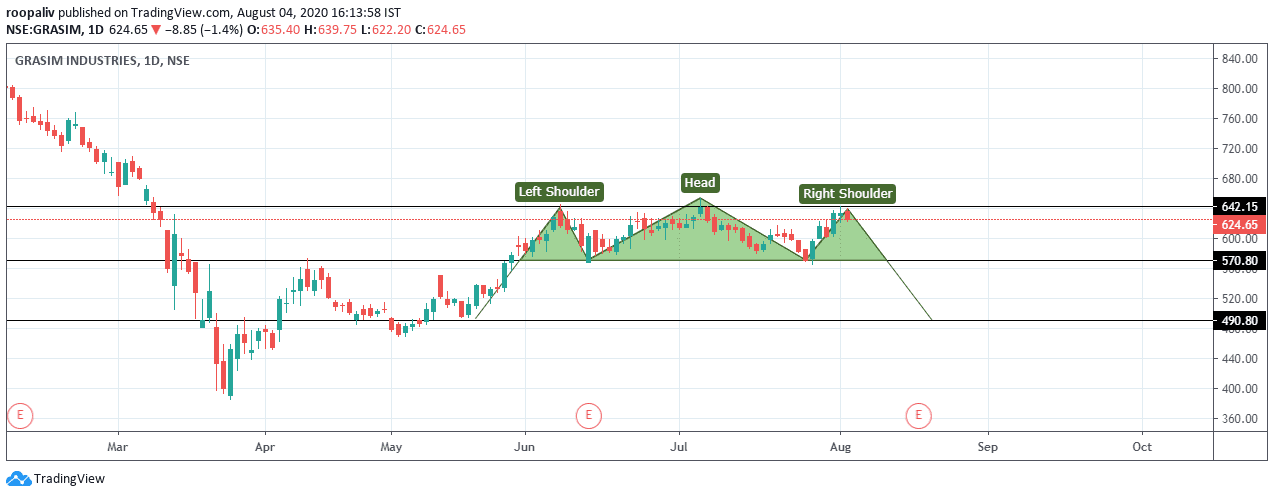
This is our weekly view. If Grasim breaks the neckline then one can short 568-564 with the TGT of 554 -544 sl above 578. However aggressive traders can take short position from CMP with sl of above 650ant tgt price of 605/585. And one can go long 644-648 with the TGT of 658-668 sl below 634.
By : ROOPALI VAISH
Note: This blog is only for educational purpose .You should be aware of the risk involved in stock market investing. Mani research is not responsible for any type of loss in financial market. Consult your financial advisor before taking any fresh position.