ICICI PRUDENTIAL looks to be forming ABCD pattern. In addition on Thursday it takes support on 200 period moving average. The 200-day simple moving average (SMA) is considered a key indicator by traders and market analysts for determining long-term market trends.
Bearish ABCD Pattern Rules
1. Point D must be higher than point B.
2. In the move from C up to D there can be no lows below point C, and no highs above point D.
3. Determine where D may complete (price)
4. Determine when point D may complete (time) for additional confirmation.
5. CD may equal AB in time.
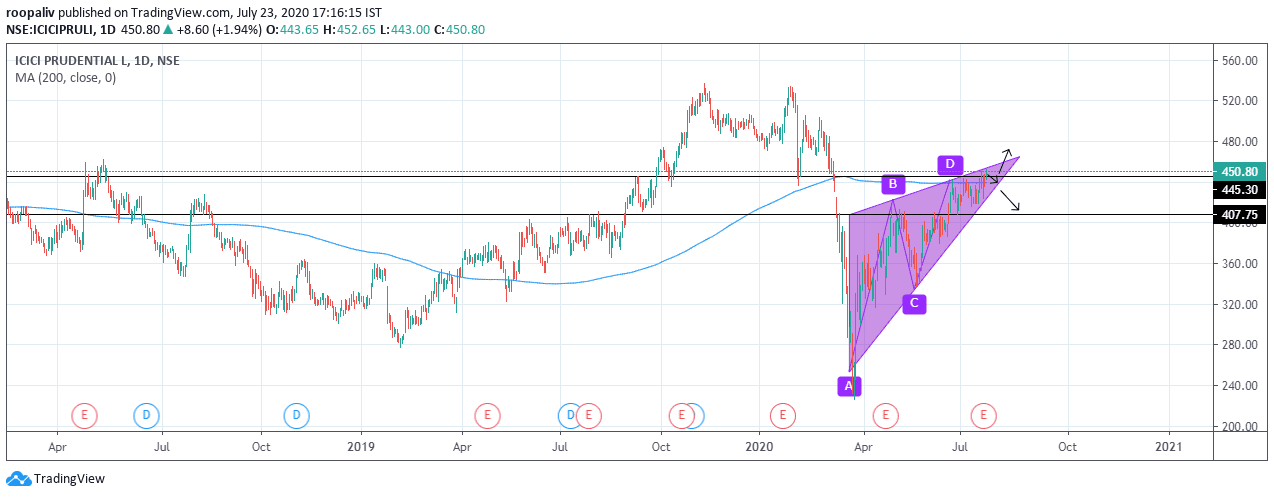
If ICICI Prudential sustains above 445.30 it will give a good up move and we can see levels of 470/490 and if it give a breakdown from 445.30 and sustains below 445.30 it will give a down movement till 407/360.
By : ROOPALI VAISH
Note: This blog is only for educational purpose .You should be aware of the risk involved in stock market investing . Mani research is not responsible for any type of loss in financial market. Consult your financial advisor before taking any fresh position