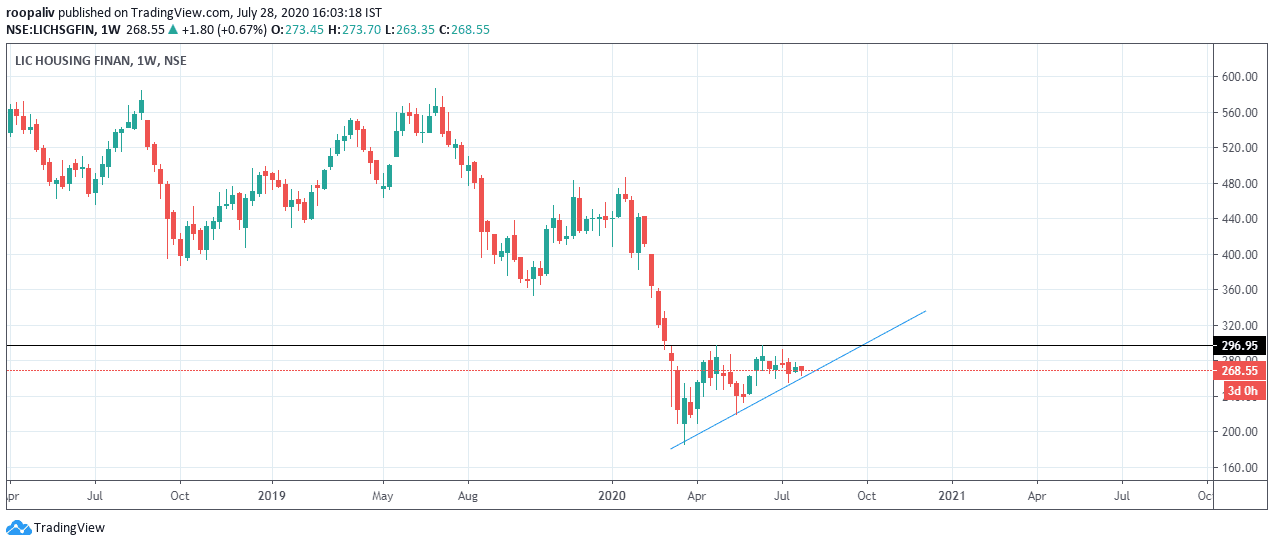
In LICHSGFIN we can see a consolidation period in weekly chart and forming a ascending symmetrical triangle pattern.
A symmetrical triangle chart pattern represents a period of consolidation before the price is forced to breakout or breakdown.
A symmetrical triangle chart pattern represents a period of consolidation before the price is forced to breakout or breakdown.
LIC housing finance have strong resistance at 297 in weekly chart and resistance of 275 in daily chart. if it breakout above 275 then we can see levels of 280/290 and if it breakdown below 275 then we can see levels of 250/230 in upcoming weeks.
Moderate risk trader can go long between 276-278 with the target of 280/289 with sl below 275 , and one can sell between 272-274 with the target of 262/255 and keep sl above 275
By : ROOPALI VAISH
Note: This blog is only for educational purpose .You should be aware of the risk involved in stock market investing . Mani research is not responsible for any type of loss in financial market. Consult your financial advisor before taking any fresh position