Company Description:
Open Text Corp. engages in the design, development, marketing and sales of enterprise information management software and solutions. It includes customer experience management (CEM), digital process automation, business network, and enterprise content management, discovery, security, and artificial intelligence (AI) and analytics solutions. It also offers consulting, managed, and learning services. The company was founded on June 26, 1991 and is headquartered in Waterloo, Canada.
Officers and Executives
Name | Age | Officer Since | Title |
54 | 2012 | President & Chief Executive Officer | |
54 | 2018 | Executive VP, Chief Financial & Accounting Officer | |
54 | 2014 | Chief Information Officer & SVP | |
57 | 2009 | Secretary & Chief Legal Officer | |
- | 2012 | Senior Vice President-Engineering |
Financial Summary
Market Cap | 10.65B | Quick Ratio | 1.1 |
Income | 279.80M | Current Ratio | 1.1 |
Sales | 3.03B | Debt/Eq | 1.05 |
Book/sh | 14.74 | LT Debt/Eq | 0.9 |
Cash/sh | 5.41 | SMA20 | 3.03% |
Dividend | 0.7 | EPS this Y | 8.30% |
Dividend % | 1.77% | EPS past 5Y | 3.20% |
Employees | 13100 | Sales past 5Y | 12.00% |
Employees | 13100 | Sales Q/Q | 13.30% |
P/E | 38.47 | EPS Q/Q | -64.60% |
PEG | 4.58 | Earnings | Apr 30 AMC |
P/B | 2.69 | SMA50 | 9.13% |
Insider Own | 2.30% | Shs Outstand | 271.22M |
Insider Trans | 0.00% | Shs Float | 266.73M |
Inst Own | 77.80% | Short Float | 2.20% |
Inst Trans | -0.52% | Short Ratio | 8.42 |
ROA | 3.10% | Target Price | 45.08 |
ROE | 7.10% | 52W Range | 29.11 - 47.85 |
ROI | 6.30% | 52W High | -17.11% |
Gross Margin | 67.70% | 52W Low | 36.22% |
Oper. Margin | 18.20% | RSI (14) | 60.56 |
Profit Margin | 9.20% | Rel Volume | 0.49 |
Payout | 67.40% | Avg Volume | 698.10K |
SMA200 | -3.08% | Volume | 3,44,852 |
Broker Report
Jul-11-19 | Reiterated | The Benchmark Company | Buy | $42 → $48 |
Nov-22-17 | Downgrade | Macquarie | Neutral → Underperform | |
Feb-16-17 | Initiated | Citigroup | Neutral | $36 |
Jan-24-17 | Resumed | Barclays | Overweight | $76 |
Jul-28-16 | Reiterated | The Benchmark Company | Buy | $65 → $75 |
Jun-21-16 | Reiterated | RBC Capital Mkts | Outperform | $60 → $70 |
Apr-28-16 | Reiterated | The Benchmark Company | Buy | $55 → $65 |
Apr-04-16 | Initiated | TD Securities | Buy | |
Feb-10-16 | Reiterated | RBC Capital Mkts | Outperform | $55 → $57 |
Feb-10-16 | Reiterated | Barclays | Overweight | $55 → $56 |
Oct-29-15 | Reiterated | Barclays | Overweight | $50 → $55 |
Jul-30-15 | Upgrade | RBC Capital Mkts | Sector Perform → Outperform | $50 → $55 |
Jul-28-15 | Reiterated | Barclays | Overweight | $56 → $50 |
May-22-15 | Reiterated | Barclays | Overweight | $61 → $56 |
May-21-15 | Reiterated | The Benchmark Company | Buy | $63 → $55 |
May-21-15 | Reiterated | The Benchmark Company | Buy | $62 → $55 |
Apr-29-15 | Reiterated | RBC Capital Mkts | Sector Perform | $60 → $55 |
Apr-29-15 | Downgrade | CIBC | Sector Outperform → Sector Perform | |
Jul-11-14 | Downgrade | RBC Capital Mkts | Outperform → Sector Perform | $60 → $55 |
Jan-24-14 | Reiterated | The Benchmark Company | Buy | $95 → $125 |
Technical Analysis Summary:
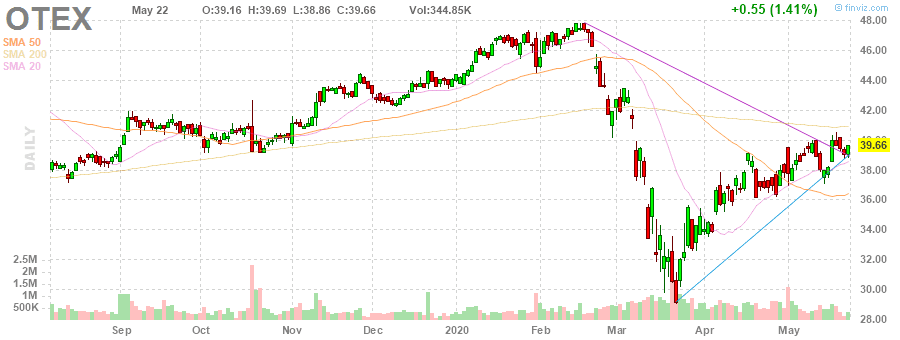
CHART
 Recommendations:
Open Text is a Fundamental Strong Company and we recommend it to keep in portfolio as all technical and fundamental indicators are in favor of uptrend however it have strong resistance at 45.95 so low risk investor can book profit between 45-46 and exit keep stop loss of 36 for current position and long term Investor can keep this stock for a longer period.
Manish Singh
Research Analyst
ManiResearch Investment Advisory
+91 8224979882
*Research Report is solely for internal purpose made on client request as on 26th May 2020, before making any investment or taking any decision kindly consult your Investment advisor.