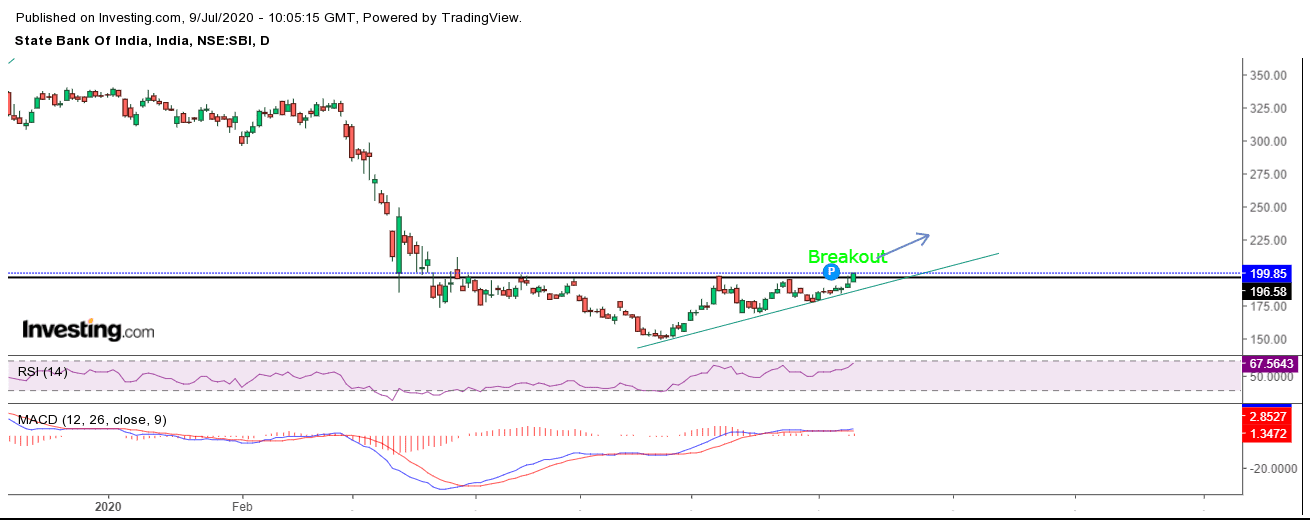
BUY SBIN 198-202 TARGET 240/280 SL BELOW 189
SBI made a breakout forming a Symmetrical ascending Triangle in Daily candle . A symmetrical triangle chart pattern represents a period of consolidation before the price is forced to breakout or breakdown. SBI had good resistance at 198 And support at 150 . But if it break 186 then go short for 181 and if it sustain near or above 198 go long for 210. RSI indicating a bullish sign which is above 60, After April 2020 SBI did not went above 200 and it test lower levels however since 20th May we see higher high’s and higher lows in SBI and finally today 09-07-2020 SBI gave breakout above 200 and made high of 201.
By: Roopali VaishRoopali Vaish
Note: Above content is only for education purpose, please do not enter in any position without consulting your investment adv